


1. Introduction
In the last 15 years, the capital market has become a major bearer of insurance risk. Today, the Assets under Management (AuM) of insurance-linked securities (ILS) funds stand at USD 106 billion (Artemis.bm, 2022e). Alternative capital funneled through these funds covers cedents against the most extreme types of events, in some cases as a complement to and in others as a substitute for traditional reinsurance. So far, the capital market has predominantly absorbed property risk from natural disasters, such as hurricanes or earthquakes. As the global risk landscape continues to evolve, however, new event risks, such as global pandemics and extreme cyber incidents, are beginning to draw the attention of the ILS industry.
Extreme cyber risks differ from ordinary cyber risks by their magnitude and their reach across borders and industries. Estimates of possible losses from an extreme cyber incident by far exceed the maximum loss realized on single natural catastrophes (Nat Cat) and even the combined losses caused by all perils in costly disaster years such as 2019 (Dreyer et al., Reference Dreyer, Jones and Klima2018; Munich Re, 2020). The economic impact of cybercrime alone is estimated at almost USD 1’000 billion (Smith & Lostri, Reference Smith and Lostri2020), making it one of the largest future threats for the economy. Yet, cyber risk is still significantly underinsured: the global premium volume for cyber coverage amounts to just USD 6.9 billion (Bundt, Reference Bundt2021).
The rising awareness of cyber threats is stimulating interest in alternative risk transfer solutions. First examples already exist: In 2016, Credit Suisse piloted a USD 223 million operational risk catastrophe bond that included cyber risk (Artemis.bm, 2018b). Moreover, Hiscox backed a parametric reinsurance deal for cloud outage risk (Artemis.bm, 2020b) and Hudson Structured, together with Aon, was involved in a transaction that covers systemic cyber risks, such as malware or distributed denial of service attacks (Artemis.bm, 2020a).
Drawing on their Nat Cat experience, some industry experts consider ILS to be the logical risk transfer instrument for extreme cyber risks (Artemis.bm, 2018a). A key element that attracts investors to ILS is their low correlation with the broader capital markets. Most Nat Cat events are globally insurable or at least globally diversifiable (Cummins, Reference Cummins2006). The impact of extreme cyber events, in contrast, is not restricted to a predefined geographical area, but may spread across boundaries and markets. Correlations between a cyber insurance book and the wider economy are therefore a serious concern (Artemis.bm, 2022c). In addition, cyber risks exhibit further characteristics that hinder securitization, such as extreme tails, a high model and parameter uncertainty, and substantial information asymmetries. It therefore remains unclear how far an ILS market for cyber risk transfer may develop on a broader scale.
We tackle this question and show under which conditions a transfer of cyber risks to the capital market may be feasible from the perspective of both investors and sponsors. To this end, we first elicit investor preferences for the key characteristics of cyber ILS through discrete choice experiments. The resulting part-worth utility profiles allow us to identify key product attributes and to evaluate different cyber ILS structures, including the one that maximizes investor utility. They also allow us to estimate the Rate on Line (RoL) required by investors to bear the risk. Subsequently, we switch to the cedent perspective. We derive the cost of equity for US property-casualty (P&C) insurers and compare it to our RoL estimates for the cyber ILS. This allows us to determine the attractiveness of the risk transfer relative to the alternative of backing a cyber insurance book with capital. Our results reveal the conditions under which both insurers and investors and might be willing to participate in the risk transfer. We find that feasibility strongly depends on the quality of the underlying cyber risk modeling and the layer to be covered by the ILS tranche. Until better models become available, cyber risk securitization will likely be restricted to high-frequency perils such as data breaches.
This paper contributes to the literature on the management of cyber risks. Recent work focused on the importance of cyber risk management for firm operating performance and reputation (Kamiya et al., Reference Kamiya, Kang, Kim, Milidonis and Stulz2021), its impact on firm value (Gatzert and Schubert, Reference Gatzert and Schubert2022), and the role of cyber threat classification and identification (Ebrahimi et al., Reference Ebrahimi, Nunamaker and Chen2020). Moreover, we add to the literature on cyber risk modeling and pricing. Cyber losses have been modeled with a focus on accumulation risk (Maillart and Sornette, Reference Maillart and Sornette2010), network contagion effects (Fahrenwaldt et al., Reference Fahrenwaldt, Weber and Weske2018), tail risk (Jung, Reference Jung2021), and spillover effects (Eisenbach et al., Reference Eisenbach, Kovner and Lee2022). Further challenges for the modeling and insurability of cyber risk include the lack of data (Cremer et al., Reference Cremer, Sheehan and Fortmann2022), adverse selection (Gordon et al., Reference Gordon, Loeb and Sohail2003), and the interdependent risk structure (Hofmann and Ramaj, Reference Hofmann and Ramaj2011).
On the practical side, we enrich the ongoing industry debate about cyber risk transfer via ILS. So far, this discussion has primarily taken place at practitioner events and through qualitative industry publications (Pain and Anchen, Reference Pain and Anchen2017; Artemis.bm, 2020c; Johansmeyer and Mican, Reference Johansmeyer and Mican2022). Despite the economic significance of the topic, however, the academic literature in this area is still scarce. Our results comprise important insights for the design of cyber ILS that lend themselves for an immediate practical application. We also document that adequately structured risk transfer instruments are a prerequisite for a meaningful cyber ILS market to emerge.
The paper is organized as follows. Section 2 measures ILS investors’ preferences for cyber ILS. The chapter begins with a derivation of ILS product attributes and levels and continues with the sample selection. Based on the discussion of the empirical results, feasible cyber ILS products are identified. Section 3 derives the cost of cyber ILS from the investor perspective and calculates spreads based on cyber loss distributions. Consecutively, we match investors’ return expectations with the supply side in Section 4. Section 5 summarizes our main findings and concludes the paper.
2. Cyber ILS from the investor perspective
2.1. Empirical methodology
We elicit investor preferences based on a discrete choice experiment (DCE), which has become a widely used approach in various fields of the social sciences, such as marketing (see, e.g., Louviere et al., Reference Louviere, Islam, Wasi, Street and Burgess2008), health economics (see, e.g., de Bekker-Grob et al., Reference de Bekker-Grob, Ryan and Gerard2012), and insurance economics (see, e.g., Braun et al., Reference Braun, Schmeiser and Schreiber2016). Specifically, we confront respondents with a series of concrete selection tasks. In each task, they face a range of three hypothetical cyber ILS instruments with a fixed set of attributes (main characteristics), but varying attribute levels. The choice data generated throughout the DCEs are used to determine the parameters of a multinomial logit (MNL) model by means of Hierarchical Bayes estimation:
 \begin{equation} \mathrm{Pr}(y_{i} = a | c_i) = \frac{\mathrm{exp}(\textbf{x}_a \boldsymbol{\beta }_i)}{\sum _{m=1}^{M}{\mathrm{exp}(\textbf{x}_m \boldsymbol{\beta }_i)}}. \end{equation}
The dependent variable is the probability of individual
 $i$
choosing alternative
$i$
choosing alternative
 $a$
in choice task
$a$
in choice task
 $c_i$
(
$c_i$
(
 $M$
equals the total number of choice tasks). The vectors
$M$
equals the total number of choice tasks). The vectors
 $\textbf{x}$
include the categorical variables for the attribute levels of the cyber ILS that appear in choice task
$\textbf{x}$
include the categorical variables for the attribute levels of the cyber ILS that appear in choice task
 $c_i$
. The logit coefficients in vector
$c_i$
. The logit coefficients in vector
 $\boldsymbol{\beta }_i = (\beta _{i1},\ldots,\beta _{iQ})'$
can be interpreted as individual-level part-worth utilities for the attribute levels 1 through Q. These MNL coefficients will allow us to estimate the relative importance of each product characteristic for every single investor. DCEs offer a number of advantages over other stated-preference methods. In contrast to interviews and surveys, DCEs ensure that respondents do not merely repeat what they read in the media. Moreover, compared to ratings or rankings, DCEs are a much more realistic emulation of the actual purchase decision (Orme, Reference Orme2009).
$\boldsymbol{\beta }_i = (\beta _{i1},\ldots,\beta _{iQ})'$
can be interpreted as individual-level part-worth utilities for the attribute levels 1 through Q. These MNL coefficients will allow us to estimate the relative importance of each product characteristic for every single investor. DCEs offer a number of advantages over other stated-preference methods. In contrast to interviews and surveys, DCEs ensure that respondents do not merely repeat what they read in the media. Moreover, compared to ratings or rankings, DCEs are a much more realistic emulation of the actual purchase decision (Orme, Reference Orme2009).
2.2. Attributes and attribute levels for the DCE
According to Koch (Reference Koch2017), ILS investors evaluate their assets based on the following decision criteria: (i) potential returns, (ii) liquidity, (iii) transparency, (iv) modelability, and (v) diversification. Hence, we select the cyber ILS attributes and attribute levels for our DCE design in line with these criteria. One of the most critical preconditions for investor interest in ILS is trust in the underlying catastrophe risk model. Such models are needed to quantify extreme event risk due to the general lack of historical data on low-frequency-high-severity events. We therefore include model risk as a product attribute in our analysis. In contrast to Nat Cat modeling for developed countries, cyber risk modeling is still in its infancy. Existing modeling capabilities depend on the actual cyber peril. Perils such as power and telecommunications outage belong to the class of unmodeled risks. Therefore, they will be assigned to the attribute level “high model risk.” “Low model risk,” in contrast, will be cyber perils for which specific modeling approaches are available, such as data breaches (see, e.g., Jung, Reference Jung2021).
Another important attribute is the format of the risk transfer instrument. Catastrophe (cat) bonds and collateralized reinsurance contracts as fully funded transactions require investors to deploy the whole risk capital upfront. Popular alternatives in the Nat Cat space are catastrophe swaps or industry loss warranties (ILWs), which may be unfunded or partially collateralized. Accordingly, we include the attribute format in our empirical study and distinguish funded from unfunded instruments.
We also take into account the maturity of the risk transfer transaction. With the exception of cat bonds, there are no active secondary markets for ILS. Thus, investors regularly hold their ILS assets to maturity and the term of the contract determines how long the capital will be locked in and exposed to the underlying risk. We consider three attribute levels for the maturity: one, three and ten years.
Another important attribute for ILS is the trigger type, which determines when the cedent receives a payout. Various alternatives have proven suitable for Nat Cat ILS. Despite initial concerns about moral hazard, the indemnity trigger is the most frequently used option in the cat bond market (Artemis.bm, 2022b). Just like traditional reinsurance, indemnity triggers are based on the actual losses of the cedent. The main alternative for cat bonds is the industry loss index trigger, which determines the payout based on an index of industry-wide losses, published by a third party data provider. For cyber risk, industry experts have pointed to the parametric trigger as a natural choice to reduce complexity and increase transparency (Artemis.bm, 2022c). Thus, we allow for three levels of the attribute trigger type: indemnity, industry loss, and parametric.
Finally, we include the attribute multiple of spread to expected loss (EL). This is a key measure for risk premiums in ILS markets (Cummins and Weiss, Reference Cummins and Weiss2009). Due to the correlated nature of extreme cyber attacks across borders and markets, investors will likely demand higher risk premiums for cyber ILS than for Nat Cat ILS. One indication for the range of potential multiples is given by Cummins and Weiss (Reference Cummins and Weiss2009), who find that average historical ILS multiples lie between two and four in soft markets and are significantly higher in hard markets. We complement these figures by comparing spread and EL of traded cat bonds from Artemis.bm (2022a). To estimate an upper bound, we focus on transactions between 2014 and 2019 that comprise unmodeled risks such as meteorite impact or volcano eruption. Table 9 in Appendix A (see supplement) contains the numbers. The multiples range from 1.24 for an EL of 14.06% among the riskier tranches up to 7.78 for an EL of 0.45% among the less risky tranches. Based on these boundaries, we decide to vary the attribute multiple in three steps: two, four and six.
Table 1 summarizes the five attributes with their respective attribute levels for our DCE design. In addition to the three hypothetical ILS instruments that participants face in each round of the DCE, we allow them to opt out from the purchase altogether if they do not consider any of the available ILS attractive enough. This allows us to estimate the participation condition of each respondent, that is, the minimum utility that a cyber ILS must generate for the investor to enter the market at all.
Table 1. Investors’ decision criteria and ILS attributes.

2.3. Sample selection
Our DCE targets specialized ILS fund managers, since they are the main investor group of this asset class. The universe of dedicated ILS funds is still relatively small. Eurekahedge, an alternative investments data provider, for example, tracks a total of 26 constituent ILS funds through its ILS Advisers Index (Eurekahedge, 2021). The dominant ILS industry website Artemis.bm, in contrast, lists 50 companies who launched ILS funds in the past (Artemis.bm, 2022e). The total number of existing ILS funds marks an upper bound for our respondent base. We established contact with the funds via a personal invitation e-mail and also posted the link to our DCE on Artemis.bm. Overall, ten ILS fund managers with 1–25 years industry experience responded to our invitation. Considering the total number of 30–50 live funds, this represents at least 25% of the market. The aggregate AuM of our respondent funds amount to USD 29 billion or about 30% of the whole ILS universe (AON, 2022).
2.4. A note on measurement error and selection bias
We undertake several methodological steps to minimize the measurement error of our part-worth utility estimates. First, complex DCE designs generally need larger samples or more tasks than small designs (see, e.g., Johnson and Orme, Reference Johnson and Orme1996). Our choice of attributes and attribute levels in Table 1 addresses this issue through a manageable degree of complexity. Second, the Hierarchical Bayes model can compensate smaller sample sizes with a larger number of choice tasks (Johnson and Orme, Reference Johnson and Orme1996). Put differently, having respondents complete more tasks is approximately as good as having more respondents (Orme, Reference Orme1998). However, asking too many tasks will lead to a loss of quality due to fatigue and boredom. We decide to run 20 choice tasks with each respondent, because at this number, the information gains still preponderate (Johnson and Orme, Reference Johnson and Orme1996). Third, we exploit a key property of the hierarchical Bayes model to further expand our respondent base and improve our part-worth estimates for the fund managers. Specifically, we include an additional 17 ILS experts in the experiment. Their responses are used to inform the aggregate-level of the model, which is the prior for the individual level (investor level).
We also address a potential selection bias. The concern is that only those ILS investors participated in our DCE who uniformly believe in a particular development of the cyber ILS market. We put this issue into perspective by offering respondents an option to tell us their opinion about the benefits of a cyber ILS. Out of ten fund managers, four consider cyber risk not to be suitable for the transfer via ILS yet, in particular due to pricing challenges. Three fund managers see the low correlation with other ILS assets as a benefit of cyber ILS and another one names high risk-adjusted returns as the core advantage. To sum up, our sample is not biased towards one particular attitude about a potential cyber ILS market.
2.5. Part-worth utilities and attribute importance
By fitting the MNL to the choice data from the DCEs, we obtain individual-level part-worth utility profiles (the MNL coefficients) for all cyber ILS attributes.Footnote 1 The mean root likelihood (RLH) for our model equals 0.658, which is approximately two times better than chance.Footnote 2 The part-worth utility profiles for all five attributes are shown in Figure 1.Footnote 3 Their shape is consistent with intuition and empirically confirms anecdotal evidence from industry sources (Artemis.bm, 2022c; Johansmeyer and Mican, Reference Johansmeyer and Mican2022). Two aspects are particularly worth highlighting: the market’s aversion to long maturities and high model risk (unmodeled risk). Cyber risk evolves very fast. Short maturities are thus important to adjust contracts and pricing on a regular basis in line with new information. They reduce uncertainty for investors and limit their exposure to long-tail cyber risk.

Figure 1. Investors’ utility profiles for each product attribute. This figure presents the individual-level part-worth utility profiles for ILS investors (dashed black lines) and other ILS experts (dashed gray lines) as well as aggregate-level median utility profiles across ILS investors (solid red lines) for all five product attributes. Due to the small sample size, we refrain from calculating highest density intervals.
We build on the part-worth utility profiles to derive the importance of the five attributes for each individual investor. The relative importance
 $\mathrm{RI}_{ik}$
of attribute
$\mathrm{RI}_{ik}$
of attribute
 $k \in \lbrace 1,2,3,4,5 \rbrace$
(see Table 1) with levels
$k \in \lbrace 1,2,3,4,5 \rbrace$
(see Table 1) with levels
 $l$
to individual
$l$
to individual
 $i$
is defined as:
$i$
is defined as:
 \begin{equation} \mathrm{RI}_{ik} = \frac{\max \limits _{l}\!(\beta _{ikl}) - \min \limits _{l}\!(\beta _{ikl})}{\sum _{k=1}^{5} \!\left ( \max \limits _{l}\!(\beta _{ikl})-\min \limits _{l}\!(\beta _{ikl})\right )}, \end{equation}
where the
 $\beta _{ikl}$
are the MNL coefficients.
$\beta _{ikl}$
are the MNL coefficients.
 $\mathrm{RI}_{ik}$
measures the contribution of an attribute to the total utility of a cyber ILS instrument in percentage terms. Figure 2 summarizes the results. Maturity exhibits the highest attribute importance (median of 47%), followed by the multiple (median of 22%) and model risk (median of 17%).Footnote 4 The three most important attributes exhibit a considerable difference between the lower and upper quartiles, suggesting heterogeneous preferences among individual respondents.
$\mathrm{RI}_{ik}$
measures the contribution of an attribute to the total utility of a cyber ILS instrument in percentage terms. Figure 2 summarizes the results. Maturity exhibits the highest attribute importance (median of 47%), followed by the multiple (median of 22%) and model risk (median of 17%).Footnote 4 The three most important attributes exhibit a considerable difference between the lower and upper quartiles, suggesting heterogeneous preferences among individual respondents.

Figure 2. Investors’ relative attribute importance. This figure presents individual-level importances across all ILS investors. The numbers denote the first (lower value) and third (upper value) quartile as well as the median. Outliers are omitted.
2.6. Feasible cyber ILS designs
Based on the individual-level part-worth utility profiles, we identify feasible cyber ILS designs. The MNL approach implies an additive utility model. We may thus compute the overall utility of a particular respondent by summing up his part-worth utility values for the attribute levels present in any given instrument. If the respondent’s total utility for a cyber ILS exceeds his participation constraint (the utility of the opt out option), the transaction is considered feasible for him. Four respondents cannot be convinced by any design. There is no combination of cyber ILS attributes that exceeds their individual non-participation threshold.
For each of the remaining respondents, we determine the set of feasible cyber ILS designs and identify the alternatives with the lowest and the highest utility therein. The utility-maximizing instrument exhibits low model risk, a funded format, a maturity of one year and a multiple of six. Regarding the trigger choice, preferences are heterogeneous and comprise all three levels (indemnity, industry loss, and parametric). The subset of instruments with the lowest, but still feasible, utility is also dominated by the attribute levels low model risk and funded format. There are only two respondents for whom high model risk or an unfunded format is acceptable. In contrast, a maturity of three years and a multiple of four works for most respondents. The views on the optimal trigger remain heterogeneous.
Finally, we identify the cyber ILS designs that would be accepted by the largest number of respondents. Based on our previous results, we restrict this analysis to instruments in a funded format with maturities between one and three years. Figure 3 displays acceptance rates across all respondents for the remaining attribute-level permutations, separated by low model risk (upper part) and high model risk (lower part). We see acceptance rates between 10 and 60% for low model risk, and between 0 and 40% for high model risk. Low model risk is relatively well accepted across triggers and maturities as long as the multiple is at least four. High model risk, in contrast, only reaches acceptance rates of 30 or 40% if it is transferred through short-term instruments (one-year maturity) and with multiples of at least four.
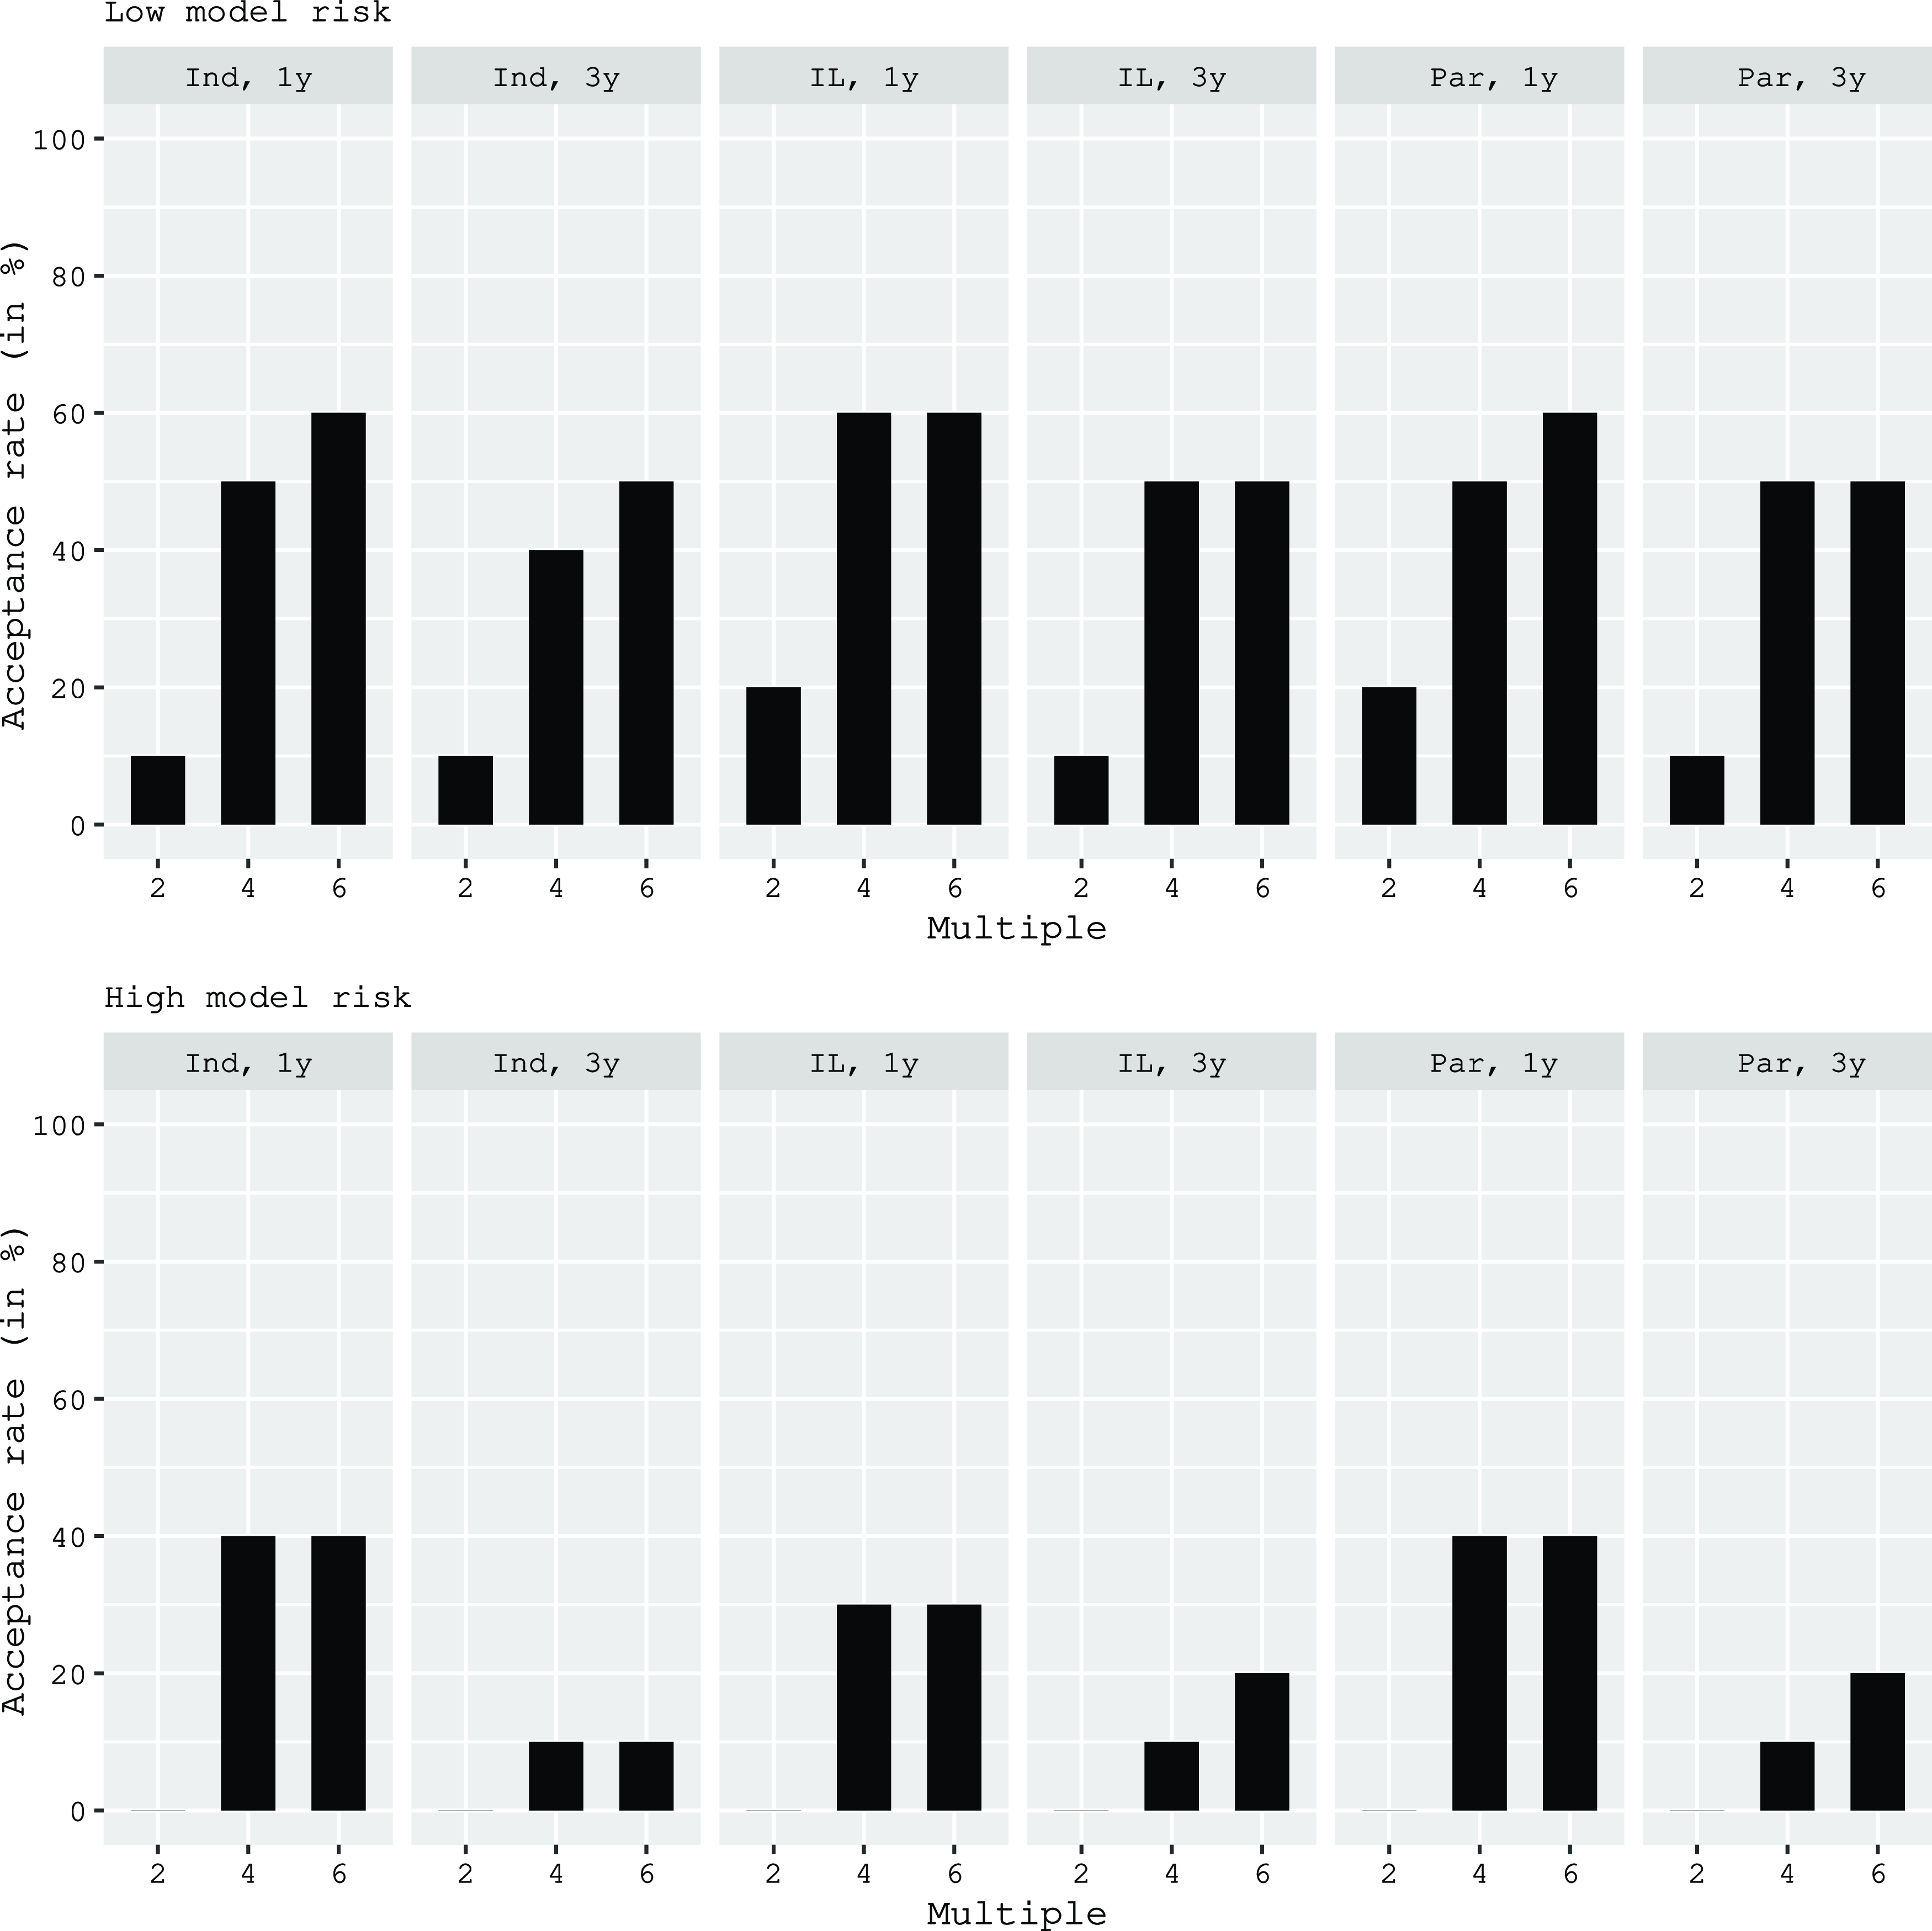
Figure 3. Investors’ acceptance rate for low and high model risk. This figure presents acceptance rates among ILS investors for different combinations of ILS product attributes. A product is considered feasible if the product utility exceeds the non-participation utility of the investor. All products incorporate a funded instrument. “Ind” denotes an indemnity trigger, “IL” denotes an industry loss trigger, and “Par” denotes a parametric trigger. “1y” denotes a maturity of one year and “3y” denotes a maturity of three years.
Overall, these results suggest that investor preferences currently limit the potential for a cyber ILS market to very specific designs and perils. However, it may not even be possible to realize this limited potential if cedents find the required multiples too high. Instead of transferring the risk to investors, they could decide to back their cyber books with risk-bearing capital. They might also find it uneconomical to underwrite larger cyber risk portfolios altogether. To determine the ultimate market potential, we therefore need to analyze the cedent perspective as well. This implies a comparison of the cost of the risk transfer to the cost of equity and calls for a translation of our estimates for the expected cyber ILS multiples into an RoL (spread). Given our results in Figure 3, the remainder of the paper focuses on cyber ILS with low model risk and a funded format. The remaining attributes will be allowed to vary across the accepted levels, that is maturities of one and three years, multiples of four and six, and indemnity or parametric triggers.
3. Cost of the cyber risk transfer
3.1. Identifying low model risk cyber perils
To translate multiples into RoLs, we must know the concrete EL of the cyber ILS tranche under consideration. EL, in turn, needs to be computed based on the attachment and exhaustion point of the tranche as well as the statistical distribution that reflects the underlying risk.Footnote 5 If we want to estimate this distribution from real-world data, we first need to identify the cyber peril that is closest to our idealized attribute level low model risk. Table 2 summarizes various cyber perils along the characteristics frequency & severity, loss correlation, data availability, and model risk. Evidently, the reliability of cyber risk models today strongly depends on the peril.
For extreme cyber events such as power outages and telco outages, historical data is scarce and reliable modeling techniques are generally unavailable. Here, scenario analysis helps to develop some understanding of the risks.Footnote 6 Nevertheless, these perils undoubtedly belong to the high model risk category. In contrast, DoS attacks, malware and data breaches, can be quantified by means of risk models. For these perils, differences persist in terms of data availability and modeling techniques. The latter include Bayesian models (Bakdash et al., Reference Bakdash, Hutchinson and Zaroukian2018), Markov chains (Fahrenwaldt et al., Reference Fahrenwaldt, Weber and Weske2018), copulas (Mukhopadhyay et al., Reference Mukhopadhyay, Chatterjee, Saha, Mahanti and Sadhukhan2013) and applications of the recursion by Panjer (Reference Panjer1981) to combine severity and frequency distributions (Denuit and Robert, Reference Denuit and Robert2020).
Table 2. Properties of different cyber perils.

Overall, data breach risk may be considered best understood to date. Over the past decades, regulatory frameworks, including breach notification requirements, have facilitated the development of rich and trustworthy time series for data breaches. Due to the availability of these time series, data breach risk has received an extensive amount of research attention (see, e.g., Edwards et al., Reference Edwards, Hofmeyr and Forrest2016). In contrast, existing Malware and DoS attack data sets are still relatively patchy (see, e.g., Cremer et al., Reference Cremer, Sheehan and Fortmann2022). Hence, data breach risk best matches our low model risk property and will be at the heart of all subsequent analyses.
3.2. Estimating the cyber risk distribution
To estimate the cyber risk distribution, we draw on breach data for the years 2006 to 2018 from the Privacy Rights Clearinghouse (PRC). The PRC has the largest and most extensive public dataset, including information on total breached records, location and date of the incident, the entity level, and an incident description. We extract the number of breached records per month and remove zero values, as they can affect the reliability of the results (see, e.g., Edwards et al., Reference Edwards, Hofmeyr and Forrest2016).
We employ the variable breached records to model the loss distribution for a cyber ILS with parametric trigger. The idea is that a parametric trigger may measure losses on a per incident basis, represented by the breach size. Moreover, to fit the underlying distribution for a cyber ILS with indemnity trigger, we transform the breach size into an estimated USD loss amount. This assumes that breach size is sufficiently correlated with the losses in the representative cedent’s cyber book. According to Jacobs (Reference Jacobs2014), this correlation is significant at the one percent level. He therefore suggests that the log-transformed loss amount can be approximated by the linear relationship:
 \begin{equation} \ln \!(\text{loss}) = 7.68 + 0.76 \cdot \ln \!(\text{breach size}). \end{equation}
We work with an updated version of this linear model as estimated by Farkas et al. (Reference Farkas, Lopez and Thomas2021), which is adjusted for the recent extreme data breach events in 2018:
 \begin{equation} \ln \!(\text{loss}) = 9.59 + 0.57 \cdot \ln \!(\text{breach size}). \end{equation}
The extant literature has suggested the log-normal distribution for the evaluation of data breach risk (Edwards et al., Reference Edwards, Hofmeyr and Forrest2016). We therefore assume that the severity for both breach size and insured losses follows a log-normal distribution:
 $Z \sim \mathcal{LN}(\mu _{LN}, \sigma _{LN})$
. We estimate the model parameters based on our monthly data for the time period from 01/2006 to 12/2018 and report the results together with goodness-of-fit measures in Table 3. The insignificant Wilcoxon test indicates a good fit of the parametric to the empirical distributions.
$Z \sim \mathcal{LN}(\mu _{LN}, \sigma _{LN})$
. We estimate the model parameters based on our monthly data for the time period from 01/2006 to 12/2018 and report the results together with goodness-of-fit measures in Table 3. The insignificant Wilcoxon test indicates a good fit of the parametric to the empirical distributions.
Table 3. Estimated model parameters of severity distribution
 $Z$
and goodness-of-fit measures. Goodness-of-fit measures include the negative log-likelihood (-Loglik), the Akaike information criterion (AIC) and the p-value of the Wilcoxon test (Wilcoxon).
$Z$
and goodness-of-fit measures. Goodness-of-fit measures include the negative log-likelihood (-Loglik), the Akaike information criterion (AIC) and the p-value of the Wilcoxon test (Wilcoxon).

Furthermore, we model the event frequency
 $N$
by means of a Poisson distribution with intensity
$N$
by means of a Poisson distribution with intensity
 $\lambda$
:
$\lambda$
:
 $N \sim Pois(\lambda )$
. We adopt the value for
$N \sim Pois(\lambda )$
. We adopt the value for
 $\lambda$
for both the indemnity and the parametric trigger from Eling and Schnell (Reference Eling and Schnell2020), who estimate the yearly intensity per cyber contract at
$\lambda$
for both the indemnity and the parametric trigger from Eling and Schnell (Reference Eling and Schnell2020), who estimate the yearly intensity per cyber contract at
 $2.60\%$
. Based on information provided in the NAIC supplements for 2021 (NAIC, 2021a), the average insurance firm has around 10’000 cyber policies in force. Thus, we calibrate the intensity parameter as follows:
$2.60\%$
. Based on information provided in the NAIC supplements for 2021 (NAIC, 2021a), the average insurance firm has around 10’000 cyber policies in force. Thus, we calibrate the intensity parameter as follows:
 $\lambda = 10$
’
$\lambda = 10$
’
 $000 \cdot 2.6\% = 260$
for ILS with a maturity of one year and
$000 \cdot 2.6\% = 260$
for ILS with a maturity of one year and
 $\lambda = 10$
’
$\lambda = 10$
’
 $000 \cdot 2.6\% \cdot 3 = 780$
for ILS with a maturity of three years.Footnote 7
$000 \cdot 2.6\% \cdot 3 = 780$
for ILS with a maturity of three years.Footnote 7
Given frequency
 $N$
and severity
$N$
and severity
 $Z$
, the aggregate risk exposure
$Z$
, the aggregate risk exposure
 $X$
is
$X$
is
 $X = \sum _{i=1}^N Z_i$
, with
$X = \sum _{i=1}^N Z_i$
, with
 $Z_i \overset{i.i.d.}{\sim } Z$
. Moreover, assuming independence of the
$Z_i \overset{i.i.d.}{\sim } Z$
. Moreover, assuming independence of the
 $Z_i$
and
$Z_i$
and
 $N$
, the cumulative distribution function (cdf)
$N$
, the cumulative distribution function (cdf)
 $F_X(x)$
of the risk exposure
$F_X(x)$
of the risk exposure
 $X$
can be expressed as:
$X$
can be expressed as:
 \begin{align} F_X(x) = \sum _{n=0}^{\infty } P_n F_Z^{n*}(x), \end{align}
where the frequency distribution is denoted by
 $P_n$
and the n-th convolution of the severity distribution is denoted by
$P_n$
and the n-th convolution of the severity distribution is denoted by
 $F_Z^{n*}$
. We use a Monte Carlo simulation with 200’000 runs to evaluate the cdf.Footnote 8 We then transform the values into log USD amounts and log breached records.
$F_Z^{n*}$
. We use a Monte Carlo simulation with 200’000 runs to evaluate the cdf.Footnote 8 We then transform the values into log USD amounts and log breached records.
Finally, we run several tests to ensure the robustness of our results. Differences in the reporting of events between the early years from 2006 to 2010 and the rest of the sample could lead to structural breaks in the data. We rule out this possibility by means of an insignificant Chow test. In addition, we run a robustness check using information on data breaches provided by the Advisen cyber loss database. This compensates for the fact that the PRC data only covers incidents in the US. We use the Advisen data to cross-check the regression coefficients from Jacobs (Reference Jacobs2014) and Farkas et al. (Reference Farkas, Lopez and Thomas2021). Specifically, we regress the log loss amount on the breach size for 621 data breach events between 2000 and 2020. The results are presented in Table 10 in Appendix B (see supplement) and confirm the updated coefficients from Farkas et al. (Reference Farkas, Lopez and Thomas2021). In the next section, we will also use the Advisen data to assess the robustness of our estimates for the EL on the cyber ILS.
3.3. Determining the cyber ILS tranche
Given the random variable
 $X$
, representing the underlying cyber risk (i.e., either breach size or insured loss), the percentage loss
$X$
, representing the underlying cyber risk (i.e., either breach size or insured loss), the percentage loss
 $L$
on an ILS tranche with a proportional payout function is defined as follows:
$L$
on an ILS tranche with a proportional payout function is defined as follows:
 \begin{align} L = \left \{ \begin{array}{l@{\quad}l} 0, & X \leq A \\[6pt] \dfrac{X-A}{E-A}, & A \lt X \leq E \\[10pt] 1, & X \gt E. \\ \end{array} \right. \end{align}
 $A$
and
$A$
and
 $E$
denote the attachment point and the exhaustion point of the ILS tranche, respectively.Footnote 9 Together with the cdf
$E$
denote the attachment point and the exhaustion point of the ILS tranche, respectively.Footnote 9 Together with the cdf
 $F_X(x)$
,
$F_X(x)$
,
 $A$
and
$A$
and
 $E$
determine the probability of first loss
$E$
determine the probability of first loss
 $PFL$
,
$PFL$
,
 \begin{equation} PFL = \mathrm{Pr}(X \gt A) = 1-F_X(A) = \int _A^\infty f_X (x) dx, \end{equation}
and the probability of exhaustion
 $POE$
,
$POE$
,
 \begin{equation} POE = \mathrm{Pr}(X \gt E) = 1-F_X(E) = \int _E^\infty f_X (x) dx, \end{equation}
for the tranche. Figure 4 illustrates how the exceedance probability curve
 $1-F_X(x)$
links
$1-F_X(x)$
links
 $A$
and
$A$
and
 $E$
with
$E$
with
 $PFL$
and
$PFL$
and
 $POE$
.Footnote 10 Evidently, shifting an ILS tranche of constant size
$POE$
.Footnote 10 Evidently, shifting an ILS tranche of constant size
 $\Delta = E - A$
to the left (right) increases (decreases) the risk exposure. In line with the funded format for our cyber ILS, we extract
$\Delta = E - A$
to the left (right) increases (decreases) the risk exposure. In line with the funded format for our cyber ILS, we extract
 $A$
and
$A$
and
 $E$
from empirical values for
$E$
from empirical values for
 $PFL$
and
$PFL$
and
 $POE$
, observed on cat bonds between 1997 and 2017. The cat bond data have been downloaded from the Lane Financial LLC website.Footnote 11
$POE$
, observed on cat bonds between 1997 and 2017. The cat bond data have been downloaded from the Lane Financial LLC website.Footnote 11
Table 4 shows the results.Footnote 12 We average
 $PFL$
and
$PFL$
and
 $POE$
across all cat bonds with a common maturity and trigger type. Subsequently, we calculate the quantiles
$POE$
across all cat bonds with a common maturity and trigger type. Subsequently, we calculate the quantiles
 $A$
and
$A$
and
 $E$
by inserting the averages for
$E$
by inserting the averages for
 $PFL$
and
$PFL$
and
 $POE$
into the inverse cdf
$POE$
into the inverse cdf
 $F^{-1}_X(x)$
. Finally, we compute the EL of the ILS tranche
$F^{-1}_X(x)$
. Finally, we compute the EL of the ILS tranche
 $\mathbb{E}(L)$
as:
$\mathbb{E}(L)$
as:
 \begin{align} \mathbb{E}(L) = PFL \times CEL, \end{align}
where
 $CEL = \mathbb{E}(L | X \gt A)$
represents the conditional expected loss.Footnote 13
$CEL = \mathbb{E}(L | X \gt A)$
represents the conditional expected loss.Footnote 13
Table 4. Observed market data of cat bonds and extracted layers. The data considers cat bonds traded between 1997 and 2017 and is retrieved from Lane Financial LLC. PFL denotes the probability of first loss and POE denotes the probability of exhaustion.


Figure 4. Shift of the ILS tranches. This figure illustrates how PFL and POE change for a shift of the ILS tranches along the exceedance probability curve
 $1 - F_X$
. The distance
$1 - F_X$
. The distance
 $\Delta$
between the attachment point A and the exhaustion point E is kept constant.
$\Delta$
between the attachment point A and the exhaustion point E is kept constant.
3.4. Cost of the risk transfer
Based on the EL estimates for our ILS tranches and the DCE results, we determine the RoLs (spreads) of the feasible products identified in the previous section. The results are summarized in Table 5. For the distributions estimated on PRC data, we obtain ELs in the range of 1.70–2.52%. The EL for cyber ILS with a parametric trigger exceeds that of cyber ILS with an indemnity trigger. Given that investors ask for multiples in the range of four to six, this results in RoLs (spreads) between 6.80% and 15.12%. In comparison to the cat bond figures provided in the last two columns, the cyber ILS thus exhibit similar ELs, but consistently higher RoLs (spreads). As a robustness test, we repeat the procedure (i) with a discretized log-normal severity and the recursion method and (ii) with global data breach information provided by Advisen and the base model simulation method. The results are also included in Table 5 and are very similar, confirming the robustness of the respective RoL ranges.
Table 5. Costs of the risk transfer and comparison to traded cat bonds. All cyber ILS exhibit a low model risk and a funded format. The span of the RoLs is calculated for a multiple of four and six, based on the PRC data. As a robustness test, we also show the EL values based on a discretized log-normal severity and the recursion method (rec) as well as Advisen data with the simulation method (sim). The last column contains average ELs and RoLs of the traded cat bonds that were used to derive our cyber ILS tranches.

4. Cyber ILS from the cedent perspective
4.1. The cost of equity for P&C insurance companies
Since capital is the most generic risk management measure available to (insurance) companies, the attractiveness of cyber risk transfer via ILS ultimately depends on the cedent’s cost of equity (CoE). We thus compare the return requirements of cyber ILS investors (supply of coverage) given by our RoL (spread) estimates to the CoE of insurers (demand for coverage). We adopt the perspective of an insurer who contemplates adding a small share of cyber policies to his P&C portfolio. To manage the tail risk, the insurer considers two options: he may back the risk with capital to be raised at the CoE. Alternatively, he can transfer the risk to investors via cyber ILS at the respective RoL. Both options are comparable, because the CoE of a diversified P&C book will be invariant to the inclusion of a small fraction of cyber risk.Footnote 14 Moreover, we may estimate the CoE based on historical return time series for P&C insurers. The reason is that, empirically, cyber risk still has a negligible impact on the CoE of insurance companies. According to Baker (Reference Baker2021), direct written cyber insurance premiums in the US amounted to a total of USD 2.7 billion in 2020. This figure is dwarfed by the USD 658 billion in total net premiums written by the US P&C insurance industry during the same year (NAIC, 2021b). In other words, cyber risk currently accounts for less than one percent of the overall risk underwritten by P&C insurers.
The CoE consists of the risk-free rate and the equity risk premium (ERP). We estimate the latter by means of the Fama-French five-factor (FF5) model (Fama and French, Reference Fama and French2015). This model is an updated version of the Fama-French three-factor (FF3) model, which has been employed to estimate the CoE of insurers by Cummins and Phillips (Reference Cummins and Phillips2005). The FF5 model is formally defined as follows:
 \begin{align*} R^e_{i,t} = \alpha _i &+ \beta _{i, MKT} MKT_t + \beta _{i, SMB} SMB_t + \beta _{i, HML} HML_t \\ &+ \beta _{i, RMW} RMW_t + \beta _{i, CMA} CMA_t + \epsilon _{i,t}. \end{align*}
Here
 $R^e_{i,t}$
denotes the excess return of stock
$R^e_{i,t}$
denotes the excess return of stock
 $i$
over the risk-free rate in month
$i$
over the risk-free rate in month
 $t$
. The five factors are: (i) the market return in excess of the risk-free rate (
$t$
. The five factors are: (i) the market return in excess of the risk-free rate (
 $MKT$
), (ii) the return difference between stocks with small and large market capitalizations (
$MKT$
), (ii) the return difference between stocks with small and large market capitalizations (
 $SMB$
), (iii) the return difference between value stocks (high book-to-market ratio) and growth stocks (low book-to-market ratio) (
$SMB$
), (iii) the return difference between value stocks (high book-to-market ratio) and growth stocks (low book-to-market ratio) (
 $HML$
), (iv) the return difference between robust stocks (high profitability) and weak stocks (low profitability) (
$HML$
), (iv) the return difference between robust stocks (high profitability) and weak stocks (low profitability) (
 $RMW$
), (v) and the return difference between stocks of firms with conservative and aggressive investment activity (
$RMW$
), (v) and the return difference between stocks of firms with conservative and aggressive investment activity (
 $CMA$
). Finally,
$CMA$
). Finally,
 $\alpha _i$
and
$\alpha _i$
and
 $\epsilon _{i,t}$
represent the intercept and the error term of the model. We collect the monthly time series of the FF5 factors from Kenneth French’s website (French, Reference French2022). Similarly, we download the time series of monthly returns for P&C insurance stocks between January 1994 and December 2020 from Thomson Reuters Eikon and subtract the one-month T-Bill rates to obtain excess returns.
$\epsilon _{i,t}$
represent the intercept and the error term of the model. We collect the monthly time series of the FF5 factors from Kenneth French’s website (French, Reference French2022). Similarly, we download the time series of monthly returns for P&C insurance stocks between January 1994 and December 2020 from Thomson Reuters Eikon and subtract the one-month T-Bill rates to obtain excess returns.
Our estimation procedure follows Cummins and Phillips (Reference Cummins and Phillips2005). We focus on the 20 largest listed P&C insurers in the US and use a rolling regression window of five years. For each insurer, we report the average equity risk premium across our rolling regression windows. We only include companies for which at least 36 months of consecutive data is available. The list of insurers together with premiums and excess CoE estimates is shown in Table 6. Since the factor model approach can be sensitive to the sample period used, we additionally report the implied equity risk premium in line with Gode and Mohanram (Reference Gode and Mohanram2003).Footnote 15
Table 6. Premiums written and equity risk premium for insurance companies. Premiums written are shown in USD million. The third column reports the average equity risk premium (ERP) estimated by means of the Fama-French five-factor model. The implied excess cost of equity based on the model of Gode and Mohanram (Reference Gode and Mohanram2003) is shown in the fourth column. The estimation period ranges from 1999 to 2020.

The mean equity risk premium across insurers equals 8.66% based on the FF5 model, which compares to 8.97% based on Gode and Mohanram (Reference Gode and Mohanram2003). As further robustness tests, we also estimate the equity risk premium with the classical FF3 model as well as the capital asset pricing model (CAPM). The FF3 model exhibits a similar mean equity risk premium equal to 7.94%. In contrast, the CAPM predicts a mean equity risk premium of 6.20%. This finding is in line with Cummins and Phillips (Reference Cummins and Phillips2005) who also report lower estimates for the CAPM compared to the FF3 model.
4.2. Comparing supply and demand
We now compare the RoL, that is, the cost of the risk transfer, to the CoE. To obtain the CoE, we add the mean equity risk premium from Table 6 to the one-year treasury constant maturity rate of 0.37% for 2020, which we retrieve from the website of the Federal Reserve Bank of St. Louis. This leads to a CoE of 0.0866 + 0.0037 = 0.0903.
Again, we focus on the set of cyber ILS that are acceptable for the investor side. Recall that those exhibit indemnity and parametric triggers, maturities of one and three years and multiples of four and six (see Table 5). For each combination of these attribute levels, we start with the empirically determined tranches from Table 4. We then vary the EL and, in turn, the spread by shifting the tranches of constant width
 $\Delta$
along the underlying log loss or log breach size distribution.
$\Delta$
along the underlying log loss or log breach size distribution.
We plot the results in Figure 5. The lower (upper) black triangles indicate the spreads of the tranches from Table 4 with a multiple of four (six). The lower (upper) black curve shows how the spreads of cyber ILS with a multiple of four (six) react to a shift of the tranches by the amount shown on the horizontal axis. For a negative (positive) shift, that is a transfer of riskier (less risky) cyber ILS tranches, the spread increases (decreases) exponentially. The horizontal black line marks the mean CoE. For spreads below this line, the market for cyber ILS should clear: there will be cedents that find the risk transfer attractive and investors willing to supply the coverage.

Figure 5. Sensitivity analysis for a shift of the ILS tranches. The attachment and exhaustion point are shifted by the amount shown on the x-axis while the distance
 $\Delta$
between the points is kept constant. A shift of zero denotes the original ILS tranche derived from traded cat bonds. The lower (upper) black curve denotes the spread calculated with a multiple of four (six). The black line denotes the mean cost of equity across the considered P&C insurance companies. Cost of equity is derived from stock returns by means of the FF5 model.
$\Delta$
between the points is kept constant. A shift of zero denotes the original ILS tranche derived from traded cat bonds. The lower (upper) black curve denotes the spread calculated with a multiple of four (six). The black line denotes the mean cost of equity across the considered P&C insurance companies. Cost of equity is derived from stock returns by means of the FF5 model.
For cyber ILS on data breach risk with an indemnity trigger (upper graphs of Figure 5) and a multiple of four, it should be possible to transfer tranches with an EL similar to those in the cat bond market (lower black triangles).Footnote 16 Since, in these cases, the costs of the risk transfer are lower than the CoE, EL could even be slightly increased by shifting the tranche to the left. For a multiple of six (upper black triangle), in contrast, the cyber ILS tranche would need to be shifted away from the risk so that EL decreases and the spread drops below the CoE. Moreover, the base case cyber ILS with a parametric trigger (lower graphs in Figure 5) are generally too expensive. For both a multiple of four and six (and the two different maturities), their spreads exceed the CoE. The only way to establish a market for these instruments is by moving the tranches to the right and thus lowering the EL below that of typical transactions in the cat bond market.
4.3. The effect of cyber risk on insurers’ cost of equity
So far we have considered an insurer with little to no cyber exposure, implying that adding cyber risk to the existing P&C book has no impact on the firm’s CoE. We now want to relax this assumption and investigate the impact of a substantial expansion of the cyber risk portfolio. There are two opposing effects at play. On the one hand, cyber risk creates diversification benefits when combined with a traditional P&C book, thus reducing the CoE.Footnote 17 On the other hand, critical loss accumulation from cyber incidents becomes more relevant when the number of cyber policies increases, implying a higher CoE.
We model the mechanics of the insurance balance sheet as follows. Assume that the firm runs for one period and let the random variables
 $\tilde{A_1}$
and
$\tilde{A_1}$
and
 $\tilde{L_1}$
denote the market values of an insurer’s assets and liabilities at time
$\tilde{L_1}$
denote the market values of an insurer’s assets and liabilities at time
 $t = 1$
:
$t = 1$
:
 \begin{align} \tilde{A}_1 = A_0 \exp \!(r_{a}) = A_0 \exp\! \Bigg[\underbrace{\left(\mu _a - \frac{\sigma _a^2}{2}\right) + \sigma _a z_{a}}_{r_{a}}\Bigg], \end{align}
 \begin{align} \tilde{L}_1 = L_0 \exp \!(r_{l}) = L_0 \exp\! \Bigg[\underbrace{\left(\mu _l - \frac{\sigma _l^2}{2}\right) + \sigma _l z_{l}}_{r_{l}}\Bigg]. \end{align}
 $A_0$
and
$A_0$
and
 $L_0$
are the deterministic market values of assets and liabilities at time
$L_0$
are the deterministic market values of assets and liabilities at time
 $t=0$
. Let the log (continuously compounded) returns
$t=0$
. Let the log (continuously compounded) returns
 $r_{a}$
and
$r_{a}$
and
 $r_{l}$
be normally distributed with means
$r_{l}$
be normally distributed with means
 $\mu _a$
and
$\mu _a$
and
 $\mu _b$
and variances
$\mu _b$
and variances
 $\sigma _a^2$
and
$\sigma _a^2$
and
 $\sigma _b^2$
(
$\sigma _b^2$
(
 $z_a$
and
$z_a$
and
 $z_b$
are standard normally distributed random variables). Then,
$z_b$
are standard normally distributed random variables). Then,
 $\tilde{A}_1$
and
$\tilde{A}_1$
and
 $\tilde{L}_1$
adhere to a log-normal distribution.
$\tilde{L}_1$
adhere to a log-normal distribution.
The log-normal distribution is consistent with our results for the heavy-tailed cyber risk distribution in Table 3 and allows for a tractable closed-form model. Assuming limited liability, the equity represents a call option on the assets with payoff
 $\tilde{E}_1 = \max \!\left(\tilde{A}_1 - \tilde{L}_1, 0\right)$
(Merton, Reference Merton1974). Using the Margrabe-Fisher formula, we obtain the following expression for the CoE:Footnote 18
$\tilde{E}_1 = \max \!\left(\tilde{A}_1 - \tilde{L}_1, 0\right)$
(Merton, Reference Merton1974). Using the Margrabe-Fisher formula, we obtain the following expression for the CoE:Footnote 18
 \begin{align} CoE = \frac{\mathbb{E}\!\left(\tilde{E_1}\right)}{E_0} - 1 = \frac{A_0}{E_0} \exp \!(\mu _a)\ \Phi (d_+) - \frac{L_0}{E_0} \exp \!(\mu _l)\ \Phi (d_-) - 1. \end{align}
 $\Phi (d_\pm )$
is the standard normal cumulative distribution function (cdf). Its argument
$\Phi (d_\pm )$
is the standard normal cumulative distribution function (cdf). Its argument
 $d_\pm$
contains the asset-liability correlation
$d_\pm$
contains the asset-liability correlation
 $\rho _{a,l}$
:
$\rho _{a,l}$
:
 \begin{align} d_\pm = \frac{\ln \!(A_0/L_0) + \left(\mu _a-\mu _l \pm \sigma ^2/2\right) }{\sigma }, \end{align}
with
 \begin{align} \sigma = \sqrt{\sigma _a^2 + \sigma _l^2 - 2 \sigma _a \sigma _l \rho _{a,l}}. \end{align}
We model
 $\rho _{a,l}$
as the weighted average of the asset-liability correlations of traditional P&C risks (
$\rho _{a,l}$
as the weighted average of the asset-liability correlations of traditional P&C risks (
 $\rho ^s_{a,l}$
) and cyber risks (
$\rho ^s_{a,l}$
) and cyber risks (
 $\rho ^c_{a,l}$
):
$\rho ^c_{a,l}$
):
 \begin{align} \rho _{a,l}(\omega _l) = (1-\omega _l) \cdot \rho _{a,l}^{s} + \omega _l \cdot \rho _{a,l}^c, \end{align}
where the weights (
 $1-\omega _l$
) and
$1-\omega _l$
) and
 $\omega _l$
reflect the fraction of traditional P&C risks and cyber risks in the insurer’s portfolio, respectively.
$\omega _l$
reflect the fraction of traditional P&C risks and cyber risks in the insurer’s portfolio, respectively.
We calibrate the model in (12) as follows. The asset characteristics
 $\mu _a$
and
$\mu _a$
and
 $\sigma _a^2$
of the representative insurer are estimated based on historical return data. We collect monthly return time series for indices, reflecting the major asset classes held by insurance companies, from Bloomberg and Thomson Reuters. Table 7 contains our estimates of the asset side parameters. The time period 2006–2018 is chosen consistent with the data available for the liability side (see below).
$\sigma _a^2$
of the representative insurer are estimated based on historical return data. We collect monthly return time series for indices, reflecting the major asset classes held by insurance companies, from Bloomberg and Thomson Reuters. Table 7 contains our estimates of the asset side parameters. The time period 2006–2018 is chosen consistent with the data available for the liability side (see below).
Table 7. Descriptive statistics for the asset portfolio. The values are estimated based on time series of monthly returns between January 2006 and December 2018. The data has been collected from Bloomberg and Thomson Reuters.

To estimate the log return on the liabilities (
 $r_{l}$
), we first decompose it into the log return on the traditional P&C book (
$r_{l}$
), we first decompose it into the log return on the traditional P&C book (
 $r_s$
) and the log return on the cyber risk book (
$r_s$
) and the log return on the cyber risk book (
 $r_c$
):
$r_c$
):
 \begin{align} r_{l} = (1-\omega _l) r_s + \omega _l r_c. \end{align}
This leads to the mean and variance
 \begin{align} \mu _{l} = (1-\omega _l) \mu _s + \omega _l \mu _c, \end{align}
 \begin{align} \sigma ^2_{l} = (1-\omega _l)^2 \sigma ^2_s + \omega _l^2 \sigma ^2_c + 2 (1-\omega _l) \omega _l \sigma _s \sigma _c \rho _{s,c}. \end{align}
 $\mu _s$
and
$\mu _s$
and
 $\mu _c$
are the mean returns on the P&C and cyber book, respectively, with corresponding variances
$\mu _c$
are the mean returns on the P&C and cyber book, respectively, with corresponding variances
 $\sigma ^2_s$
and
$\sigma ^2_s$
and
 $\sigma ^2_c$
and correlation
$\sigma ^2_c$
and correlation
 $\rho _{s,c}$
. We determine the parameters for the P&C portfolio from loss data for the US P&C industry provided by the Insurance Information Institute (III). Our estimates for the cyber risk portfolio are based on median yearly USD-transformed data breaches published by the PRC. Table 8 summarizes our input values for the liability side. In addition, Figure 6 highlights the differences in shape between the aggregate loss distribution for the P&C and the cyber risk book.
$\rho _{s,c}$
. We determine the parameters for the P&C portfolio from loss data for the US P&C industry provided by the Insurance Information Institute (III). Our estimates for the cyber risk portfolio are based on median yearly USD-transformed data breaches published by the PRC. Table 8 summarizes our input values for the liability side. In addition, Figure 6 highlights the differences in shape between the aggregate loss distribution for the P&C and the cyber risk book.
Table 8. Descriptive statistics for the liability portfolio. The values are estimated based on a time series of yearly observations between 2006 and 2018. The estimates for the P&C portfolio are based on losses incurred by the US P&C industry retrieved from the Insurance Information Institute. The estimates for the cyber portfolio are based on mean yearly USD-transformed data breaches published by PRC.


Figure 6. Aggregate loss distribution for the P&C and the cyber risk book. The solid line denotes traditional P&C risks, and the dashed line denotes cyber risks.
Having determined the means and standard deviations for the asset and liability side, we are left with the following unknown parameters:
 $A_0$
,
$A_0$
,
 $L_0$
,
$L_0$
,
 $\rho ^s_{a,l}$
,
$\rho ^s_{a,l}$
,
 $\rho ^c_{a,l}$
, and
$\rho ^c_{a,l}$
, and
 $\rho _{s,c}$
. We set
$\rho _{s,c}$
. We set
 $A_0$
and
$A_0$
and
 $L_0$
to a typical capital structure for the P&C industry:
$L_0$
to a typical capital structure for the P&C industry:
 $A_0 = 1$
,
$A_0 = 1$
,
 $L_0=0.9$
. This leads to
$L_0=0.9$
. This leads to
 $E_0 = 0.1$
,
$E_0 = 0.1$
,
 $A_0/L_0 = 1.11$
,
$A_0/L_0 = 1.11$
,
 $A_0/E_0 = 10$
and
$A_0/E_0 = 10$
and
 $L_0/E_0 = 9$
.
$L_0/E_0 = 9$
.
Finally, we turn to the correlations. We set the asset-liability correlation
 $\rho ^s_{a,l}$
for traditional P&C risk (without cyber risk) so that Equation (12) matches the empirically estimated CoE of 0.0903. In doing so, we assume
$\rho ^s_{a,l}$
for traditional P&C risk (without cyber risk) so that Equation (12) matches the empirically estimated CoE of 0.0903. In doing so, we assume
 $\omega _l = 0$
, implying that Equations (15) and (18) collapse to
$\omega _l = 0$
, implying that Equations (15) and (18) collapse to
 $\rho _{a,l} = \rho ^s_{a,l}$
and
$\rho _{a,l} = \rho ^s_{a,l}$
and
 $\sigma ^2_{l} = \sigma ^2_{s}$
, respectively. A standard root search yields
$\sigma ^2_{l} = \sigma ^2_{s}$
, respectively. A standard root search yields
 $\rho _{a,l}^{s} \approx 0.3$
. Lacking any reliable data for the estimation of the remaining two correlations, we fix
$\rho _{a,l}^{s} \approx 0.3$
. Lacking any reliable data for the estimation of the remaining two correlations, we fix
 $\rho _{s,c}$
at 0.3 and consider different values for
$\rho _{s,c}$
at 0.3 and consider different values for
 $\rho _{a,l}^{c} \in \{0.1, 0.3, 0.5\}$
. We also vary the share of cyber risk in the P&C book as follows:
$\rho _{a,l}^{c} \in \{0.1, 0.3, 0.5\}$
. We also vary the share of cyber risk in the P&C book as follows:
 $\omega _l \in [0,1]$
.
$\omega _l \in [0,1]$
.
The results are shown in Figure 7. The black curves represent the CoE for the three values of
 $\rho _{a,l}^{c}$
and varying fractions of cyber risk
$\rho _{a,l}^{c}$
and varying fractions of cyber risk
 $\omega _l$
in the overall portfolio. At first, the curves are downward sloping, because the addition of cyber risk to a traditional P&C portfolio improves diversification. The CoE-minimizing share of cyber risk in the insurance book is reached around 15% in all considered cases (see black triangles).Footnote 19 Once this fraction is surpassed, adding further cyber exposure raises the CoE, because the accumulation risk overrides the diversification benefits. The dashed lines reflect the cheapest and most expensive cost of a risk transfer through cyber ILS taken from Table 5. Comparing these lines to the CoE curves, it becomes clear that cyber ILS are particularly useful for insurers with little or a lot of cyber risk exposure. Between a weight of 5% and 25%, in contrast, the diversification benefits of the cyber book lead to a CoE that appears cheap relative to the RoLs demanded by cyber ILS investors.
$\omega _l$
in the overall portfolio. At first, the curves are downward sloping, because the addition of cyber risk to a traditional P&C portfolio improves diversification. The CoE-minimizing share of cyber risk in the insurance book is reached around 15% in all considered cases (see black triangles).Footnote 19 Once this fraction is surpassed, adding further cyber exposure raises the CoE, because the accumulation risk overrides the diversification benefits. The dashed lines reflect the cheapest and most expensive cost of a risk transfer through cyber ILS taken from Table 5. Comparing these lines to the CoE curves, it becomes clear that cyber ILS are particularly useful for insurers with little or a lot of cyber risk exposure. Between a weight of 5% and 25%, in contrast, the diversification benefits of the cyber book lead to a CoE that appears cheap relative to the RoLs demanded by cyber ILS investors.

Figure 7. Composite portfolio. This figure shows the reference portfolio composed of traditional P&C and cyber risks. The black dot represents the pure P&C portfolio. To the right of this point, the share of cyber risk in the composite portfolio increases. The portfolio costs are shown for different cyber liability correlations
 $\rho _{a,l}^{c} \in \{0.1, 0.3, 0.5\}$
. Increasing
$\rho _{a,l}^{c} \in \{0.1, 0.3, 0.5\}$
. Increasing
 $\rho _{a,l}^{c}$
raises the cost of equity. The black triangles mark the CoE-minimizing portfolios. The dashed lines denote the range of spreads demanded by investors for the cyber risk transfer via ILS based on the results in Table 5.
$\rho _{a,l}^{c}$
raises the cost of equity. The black triangles mark the CoE-minimizing portfolios. The dashed lines denote the range of spreads demanded by investors for the cyber risk transfer via ILS based on the results in Table 5.
5. Conclusion
We investigate the feasibility of cyber risk transfer through ILS. On the investor side, we elicit the preferred characteristics of cyber ILS and the corresponding return expectations. We then estimate the CoE of insurers and compare it to the RoL expected by investors to match demand for and supply of coverage in the cyber ILS market. Our results contain several important insights.
In the first part of the study, we identify maturity, multiple, and model risk as the key characteristics of cyber ILS from the investor perspective. Investors appear to prefer short maturities, high multiples, low model risk, and a funded format. They are particularly averse to model risk. Although we identified a small number of cases, in which cyber perils with a high model risk could be transferred, the extreme multiples necessary in these cases severely limit a potential cyber ILS market. This is a reminder that improperly quantified risks are hard to insure both in the classical insurance market as well as through alternative risk transfer. The recent launch of an exposure database by CyberCube is a promising development towards a better understanding of various cyber perils (Artemis.bm 2022d.,). Such initiatives may help to reduce model risk and thus expand the cyber ILS market in the future.
In the second part of our study, we find that the spread of cyber ILS will have to be significantly higher than that of cat bonds with a comparable EL. This raises the question whether cedents are willing to pay such markups for the transfer of extreme cyber ILS. In the third part, we therefore document that a cyber ILS market may indeed evolve for well understood cyber perils, such as data breach risk. Cyber ILS with risk metrics (PFL and EL) comparable to cat bonds and a low model risk will need to carry spreads in the range between 6.80 and 15.12%, depending on the trigger choice and maturity. The comparison to the mean excess CoE across US P&C insurers of approximately 9% indicates the potential for both parties to agree on a risk transfer. Finally, we analyze how the CoE hurdle on the cedent side changes with different fractions of cyber risk in the overall P&C book. We model the diversification benefits of cyber risk and find the CoE-minimizing portfolio weight at around 15%. This indicates that risk transfer via cyber ILS will be particularly attractive for insurers with much lower or much higher fractions of cyber risk in their books.
Despite careful model specification and calibration, the results of this paper merit a critical discussion. Our study undertakes a first step in understanding the economics of cyber ILS in absence of real market data for such instruments. As a consequence, our inputs need to rely on various proxies such as investor preferences from DCEs, risk metrics from traded cat bonds, cyber risk databases and implied parameter estimates. Our results can therefore by no means be exact and should not be considered advice for an optimal practical implementation. A real P&C insurer will, for example, be very unlikely to include 15% cyber risk in his portfolio as long as the risk itself is not better understood. Nevertheless, our analyses help to establish an early understanding of potential success factors for a cyber ILS market. They may thus serve as an orientation for future research and pilot transactions by industry practitioners.
To sum up, a larger cyber ILS market will not develop unless cyber risk modeling overcomes its infancy, a fact that is often recognized by ILS industry sources (Artemis.bm, 2022c). This indicates a main direction for further research: A better understanding of the dependence structure of cyber risk and more data are required to develop sophisticated models. Similarly, the dynamic nature of cyber incidents as man-made events require different modeling techniques than natural catastrophe risk. More research is also required with regard to investor preferences. The results of our DCEs are limited by the small sample size. Since we assess a potential cyber ILS market under model and pricing insecurity, our results provide a first indication of the underlying dynamics rather than a precise real-world estimation. Once actual market data for cyber ILS exists, our work could be complemented with more accurate estimates of the RoLs demanded by investors.
Competing interest
There are no competing interest to declare.
Supplementary material
To view supplementary material for this article, please visit https://doi.org/10.1017/asb.2023.22.


 Open access